 FAO Map Catalog
30 arc/sec
Type of resources
Available actions
Topics
Keywords
Contact for the resource
Provided by
Years
Formats
Representation types
Update frequencies
status
Resolution
-

The “governance index” is related to potential effectiveness of any governmental response during and after exposure to climate stress in 2010. Generally well-structured governmental institutions are able to enhance the resilience of its members and citizen promoting adaptation strategies and action. The index results from the first cluster of the Principal Component Analysis preformed among 18 potential variables. The analysis identifies seven dominant variables, namely “openness to external assistance”, “regulatory quality”, “government effectiveness”, “voice and accountability”, “failed state”, “perceived corruption” and “criminal rate”, assigning equal weight of 0.1525 except to “criminal rate” that retrieve a weight of 0.085. Before to perform the analysis “criminal rate” was log transformed to shorten the extreme variation and then all variables were score-standardized (converted to distribution with average of 0 and standard deviation of 1; inverse method was applied for “criminal rate”) in order to be comparable. All the variables are country base and the tabular data were linked by country to the national boundaries shapefile (FAO/GAUL) and then converted into raster format (resolution 0.5 arc-minute). The variable “openness to external assistance” was compute as the average values of the period 2008-2012 of the KOF Index of Globalization that serves as a proxy for a country’s level of global integration. It uses data on three dimensions of globalization (economic, social and political) to create an overall globalization score between zero and 100 that measures a country’s level of integration in the global system. The variables “regulatory quality”, “government effectiveness” and “voice and accountability” are gathered from the World Bank’s Worldwide Governance Indicators, considering the average of the period 2008-2012. “Regulatory quality” captures perceptions of the ability of the government to formulate and implement sound policies and regulations that permit and promote private sector development. “Government effectiveness” captures perceptions of the quality of public services, the quality of the civil service and the degree of its independence from political pressures, the quality of policy formulation and implementation, and the credibility of the government's commitment to such policies. “Voice and accountability captures perceptions of the extent to which a country's citizens are able to participate in selecting their government, as well as freedom of expression, freedom of association, and a free media. The “failed state” variable is based on the average 2008-2012 of the fragile state index that is a compilation of 12 socio-economic and political variables made by the Fund for Peace. It aims to capture the vulnerability to any kind of stress of a certain state. The “perceived corruption” variable is based on the homonym index published by Transparency International (NGO) averaged from 2008 to 2012. It assesses the level of corruption using qualitative surveys. Finally the “criminal rate” records the average rate (per 100,000 people) of unlawful death, as defined and assessed by the UN Office on Drugs and Crime, in the period 2008-2012. A country with a higher degree of global integration will be better positioned to obtain disaster assistance from the international community. Autarkic or less well-integrated countries may be less able or willing to receive outside assistance in the event of extreme weather events. Such assistance could take the form of aid from bilateral or multilateral donors or international humanitarian organizations, or it could be in the form of remittances from overseas family or diasporas of the affected population. The Worldwide Governance Indicators define the level of expected assistance to citizens to better coping and manage with climate stressors and disaster events in situations measuring the good governance degree of a state. The failed state index measures the state ability to implement adaptation strategies measuring its vulnerability. People living in countries with higher level of corruption are thought to have more difficulties recovering from climate change impacts, due to limited governmental support reaching affected population compared to states with lower level of corruption. Corruption can further be of particular importance when it comes to the distribution of and access to emergency relief resources. Finally the criminal rate is included because violence severely limits a government’s ability to deliver assistance and indicate a lack of authority by central government. This dataset has been produced in the framework of the “Climate change predictions in Sub-Saharan Africa: impacts and adaptations (ClimAfrica)” project, Work Package 4 (WP4). More information on ClimAfrica project is provided in the Supplemental Information section of this metadata.
-
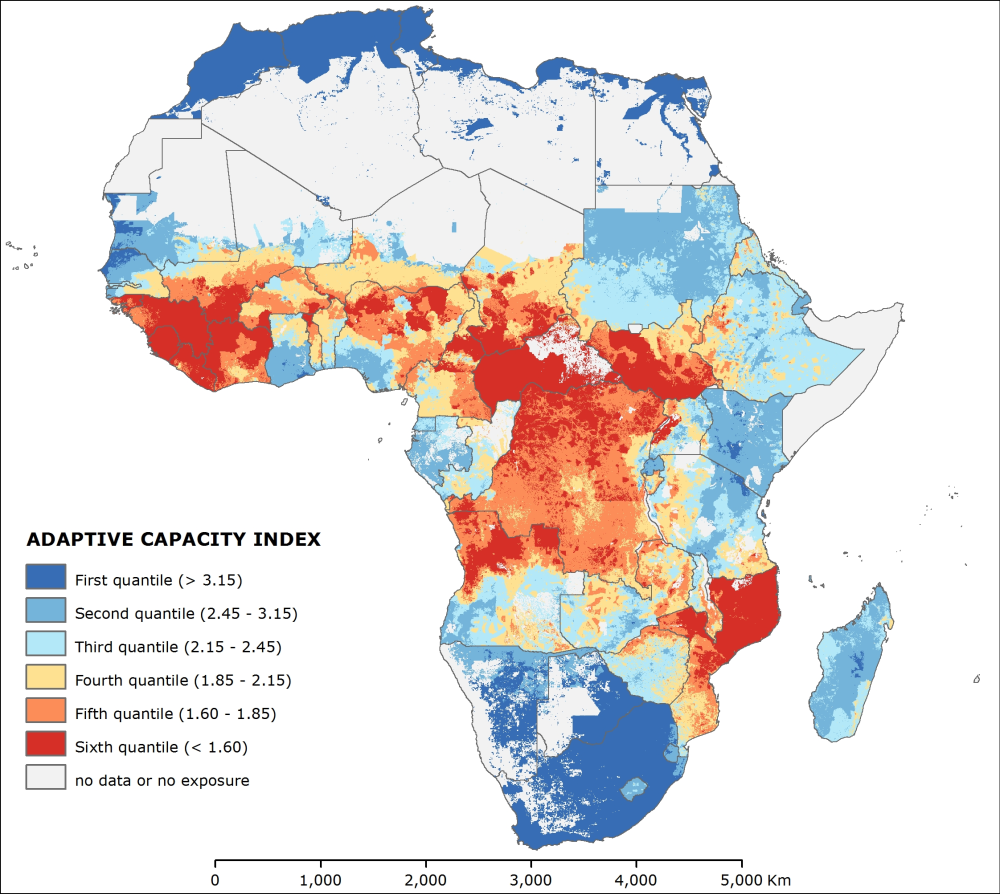
The “adaptive capacity index” symbolizes the adaptive potential to implement adaptation measures that help avert potential impacts in 2010. Adaptive capacity is a significant factor in characterizing vulnerability. The IPCC (2001) describes adaptive capacity as the potential or ability of a system, region, or community to adjust to the effects or impacts of climate change (including climate variability and extremes). Adaptive capacity is considered to be “a function of wealth, technology, education, information, infrastructure, skills, access to resources and stability and management capabilities”. The means of the adaptive capacity are the assets and entitlements that communities and individuals can mobilize in the face of environmental change. The more assets people have, the less vulnerable they are and vice versa. Here adaptive capacity is described as being dependent upon four assets: human capital, technological capital, financial capital and institutional capital. Therefore, the “adaptive capacity index” derived from the addition of four underlying indexes: the “human capital index”, the “technological capital index”, the “financial capital index” and the “institutional capital index”. Principal Component Analysis determines the weights of the four underlying indexes. The analysis run among the variables that compose such indexes and results in four weights: 0.58 for the “human capital index”, 0.16 for the “technological capital index”, 0.20 for the “financial capital index” and finally 0.06 for the “institutional capital index”. This dataset has been produced in the framework of the “Climate change predictions in Sub-Saharan Africa: impacts and adaptations (ClimAfrica)” project, Work Package 4 (WP4). More information on ClimAfrica project is provided in the Supplemental Information section of this metadata.
-

The “financial development index” symbolizes the degree of financial development of a country in 2010. Well-developed financial systems may reduce climate change impact because it underlying the diffusion of services and tertiary economic activity that reduce the dependence to agriculture income of a certain population. The index results from the first cluster of the Principal Component Analysis preformed among 9 potential variables. The analysis identifies three dominant variables, namely “investment per capita”, “global commerce volume per capita” and “gross national saving per capita”, assigning weights of 0.35, 0.35 and 0.3, respectively. Before to perform the analysis all variables were log transformed to shorten the extreme variation and then were score-standardized (converted to distribution with average of 0 and standard deviation of 1) in order to be comparable. Country based data for “investment per capita” (expressed as a ratio of total investment in current local currency and GDP in current local currency. Investment or gross capital formation is measured by the total value of the gross fixed capital formation and changes in inventories and acquisitions less disposals of valuables for a unit or sector), “global commerce volume per capita” (expressed as a ratio of commerce volume in current local currency and GDP in current local currency. Commerce volume is the sum of exports and imports of goods and services) and “gross national saving per capita” (expressed as a ratio of gross national savings in current local currency and GDP in current local currency. Gross national saving is gross disposable income less final consumption expenditure after taking account of an adjustment for pension funds) were collected jointly from International Monetary Fund and World Bank (for global commerce volumes) and records the average of the period 2008-2012. The variables represent the share of GDP, thus they were multiplied by total GDPppp in order to have absolute value in international dollars and then divided by population to calculate the per capita values of each variable. The tabular data were linked by country unit to the national boundaries shapefile (FAO/GAUL) and then converted into raster format (resolution 0.5 arc-minute). Investment and global commerce per capita are proxy of economic transition out of agriculture, while national gross saving represents the financial resources buffer that can facilitate the implementation of climate change adaptation strategies. This dataset has been produced in the framework of the “Climate change predictions in Sub-Saharan Africa: impacts and adaptations (ClimAfrica)” project, Work Package 4 (WP4). More information on ClimAfrica project is provided in the Supplemental Information section of this metadata.
-
The “public health index” describes the general health status of a certain area in 2010. The degree of health status is an important factor of adaptive capacity because the epidemics deepens poverty, reverses human development achievements, worsens gender inequalities, erodes the ability of governments to maintain essential services, reduces labor productivity and supply, and puts a brake on economic growth. The index results from the first cluster of the Principal Component Analysis preformed among 16 potential variables. The analysis identify four dominant variables, namely “TBC incidence”, “Plasmodium entomological inoculation rate”, “Plasmodium endemic rate” and “Tsetse fly potential habitat”, assigning respectively the weights of 0.2, 0.28, 0.26 and 0.26. Before to perform the analysis all the variables were log transformed to shorten the extreme variation and then were score-standardized (converted to distribution with average of 0 and standard deviation of 1; all variables with inverse method) in order to be comparable. Country-based data of TBC incidence were collected from World Bank. In particular the average of the period 2008-2012 was computed. Tabular data were linked by country to the national boundaries shapefile (FAO/GAUL) and then converted into raster format (resolution 0.5 arc-minute). The 0.5 arc-minute grids on “Plasmodium entomological inoculation rate” and “Plasmodium endemic rate”, produced by Malaria Atlas Project of Oxford University, measure the intensity of malaria transmission in 2010. The first is the number of P. falciparum infective bites received by an individual annually, while the second mapped the age-standardized P. falciparum Parasite Rate which describes the estimated proportion of 2-10 year olds in the general population that are infected with P. falciparum at any one time, averaged over the 12 months of 2010. The 3 arc-minute grid “Tsetse fly potential habitat” were gathered from the three fly groups for 1999 from FAO geonetwork and then was sampled at 0.5 arc-minute. TBC, Tsetse and malaria are important diseases in Africa and thus are main thread to adaptive capacity enhancement in Africa. Areas with large diffusion of such epidemic diseases have weak resilience degree and low capacity to implement climate change adaptation actions. This dataset has been produced in the framework of the “Climate change predictions in Sub-Saharan Africa: impacts and adaptations (ClimAfrica)” project, Work Package 4 (WP4). More information on ClimAfrica project is provided in the Supplemental Information section of this metadata.
-

The “richness index” represents the level of economical wellbeing a country certain area in 2010. Regions with higher income per capita and low poverty rate and more access to market are wealthier and are therefore better able to prepare for and respond to adversity. The index results from the second cluster of the Principal Component Analysis preformed among 9 potential variables. The analysis identifies four dominant variables, namely “GDPppp per capita”, “agriculture share GDP per agriculture sector worker”, “poverty rate” and “market accessibility”, assigning weights of 0.33, 0.26, 0.25 and 0.16, respectively. Before to perform the analysis all variables were log transformed (except the “agriculture share GDP per agriculture sector worker”) to shorten the extreme variation and then were score-standardized (converted to distribution with average of 0 and standard deviation of 1; inverse method was applied for the “poverty rate” and “market accessibility”) in order to be comparable. The 0.5 arc-minute grid total GDPppp is based on the night time light satellite imagery of NOAA (see Ghosh, T., Powell, R., Elvidge, C. D., Baugh, K. E., Sutton, P. C., & Anderson, S. (2010).Shedding light on the global distribution of economic activity. The Open Geography Journal (3), 148-161) and adjusted to national total as recorded by International Monetary Fund for 2010. The “GDPppp per capita” was calculated dividing the total GDPppp by the population in each pixel. Further, a focal statistic ran to determine mean values within 10 km. This had a smoothing effect and represents some of the extended influence of intense economic activity for the local people. Country based data for “agriculture share GDP per agriculture sector worker” were calculated from GDPppp (data from International Monetary Fund) fraction from agriculture activity (measured by World Bank) divided by the number of worker in the agriculture sector (data from World Bank). The tabular data represents the average of the period 2008-2012 and were linked by country unit to the national boundaries shapefile (FAO/GAUL) and then converted into raster format (resolution 0.5 arc-minute). The first administrative level data for the “poverty rate” were estimated by NOAA for 2003 using nighttime lights satellite imagery. Tabular data were linked by first administrative unit to the first administrative boundaries shapefile (FAO/GAUL) and then converted into raster format (resolution 0.5 arc-minute). The 0.5 arc-minute grid “market accessibility” measures the travel distance in minutes to large cities (with population greater than 50,000 people). This dataset was developed by the European Commission and the World Bank to represent access to markets, schools, hospitals, etc.. The dataset capture the connectivity and the concentration of economic activity (in 2000). Markets may be important for a variety of reasons, including their abilities to spread risk and increase incomes. Markets are a means of linking people both spatially and over time. That is, they allow shocks (and risks) to be spread over wider areas. In particular, markets should make households less vulnerable to (localized) covariate shocks. This dataset has been produced in the framework of the “Climate change predictions in Sub-Saharan Africa: impacts and adaptations (ClimAfrica)” project, Work Package 4 (WP4). More information on ClimAfrica project is provided in the Supplemental Information section of this metadata.
-
The “agriculture resources sensitivity” represents the agriculture potential in 2010. This potential is measured by the availability of land and food production per capita, and the main thread to agriculture land, represented by desertification risk. The index results from the second cluster of the Principal Component Analysis preformed among 16 potential variables. The analysis identify four dominant variables, namely “potential rain-fed food production per capita”, “cropland crowding”, “desertification index” and “topographic resources availability”, assigning respectively the weights of 0.29, 0.29, 0.27 and 0.15. Before to perform the analysis all the variables were log transformed to shorten the extreme variation and then were score-standardized (converted to distribution with average of 0 and standard deviation of 1; all variables with inverse method except “desertification index”) in order to be comparable. The 5 arc-minute grid “potential rain-fed food production per capita” of 2007 was gathered from FAO GeoNetwork and then sampled at 0.5 arc-minutes. It was multiplied by crop land occurrence dataset, extracted from the FAO Global Land Cover-SHARE dataset of 2014 and divided by population grid in order to compute the per capita values. The 0.5 arc-minute grid “cropland crowding” of 2010 was produced dividing the crop land occurrence (FAO Global Land Cover-SHARE) by the population. The 0.5 arc-minute grid “desertification index” of 2000 was measured in terms of number of months recording values less than 0.75 of the ratio between precipitation (current monthly average) and potential evapo-transpiration (PET, current monthly average). Data of precipitation and PET were gathered from Worldclim and from CGIAR Consortium for Spatial Information, respectively. Finally the 0.5 arc-minute grid “topographic resources availability” was produced within the ClimAfrica project based on SRTM DEM of NASA. The “potential rain-fed food production per capita” measures the availability of food in a certain area produced with subsistence techniques. Cells with low food production are sensitive to climate change impacts because the low input agriculture (dominant in Africa) may not produced sufficient food quantities to support the local populations. The “cropland crowding” is an indicator that assess the availability of crop land hectares per 1,000 people. Sensitive areas are where few crop lands are shared by large population. The “desertification index” assesses the climatological risk of a certain area to be subjected to desertification due to lack of rainfall. Such areas are more sensitive to lost crop land and thus food production quantities due to climate change impacts. The “topographic resources availability” is the percentage of each cell with slopes equal to or lower than 15 %. Landscapes strongly dissected contain less land with agriculture values than plain landscapes. The scarcity of agriculture land may increase the fragility of a system because unable to increase to crop surface to cope with climate change impacts. This dataset has been produced in the framework of the “Climate change predictions in Sub-Saharan Africa: impacts and adaptations (ClimAfrica)” project, Work Package 4 (WP4). More information on ClimAfrica project is provided in the Supplemental Information section of this metadata.
-
The Gross Domestic Product per capita (gross domestic product divided by mid-year population converted to international dollars, using purchasing power parity rates) has been identified as an important determinant of susceptibility and vulnerability by different authors and used in the Disaster Risk Index 2004 (Peduzzi et al. 2009, Schneiderbauer 2007, UNDP 2004) and is commonly used as an indicator for a country’s economic development (e.g. Human Development Index). Despite some criticisms (Brooks et al. 2005) it is still considered useful to estimate a population’s susceptibility to harm, as limited monetary resources are seen as an important factor of vulnerability. However, collection of data on economic variables, especially sub-national income levels, is problematic, due to various shortcomings in the data collection process. Additionally, the informal economy is often excluded from official statistics. Night time lights satellite imagery of NOAA grid provides an alternative means for measuring economic activity. NOAA scientists developed a model for creating a world map of estimated total (formal plus informal) economic activity. Regression models were developed to calibrate the sum of lights to official measures of economic activity at the sub-national level for some target Country and at the national level for other countries of the world, and subsequently regression coefficients were derived. Multiplying the regression coefficients with the sum of lights provided estimates of total economic activity, which were spatially distributed to generate a 30 arc-second map of total economic activity (see Ghosh, T., Powell, R., Elvidge, C. D., Baugh, K. E., Sutton, P. C., & Anderson, S. (2010).Shedding light on the global distribution of economic activity. The Open Geography Journal (3), 148-161). We adjusted the GDP to the total national GDPppp amount as recorded by IMF (International Monetary Fund) for 2010 and we divided it by the population layer from Worldpop Project. Further, we ran a focal statistics analysis to determine mean values within 10 cell (5 arc-minute, about 10 Km) of each grid cell. This had a smoothing effect and represents some of the extended influence of intense economic activity for local people. Finally we apply a mask to remove the area with population below 1 people per square Km. This dataset has been produced in the framework of the "Climate change predictions in Sub-Saharan Africa: impacts and adaptations (ClimAfrica)" project, Work Package 4 (WP4). More information on ClimAfrica project is provided in the Supplemental Information section of this metadata.
-
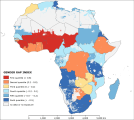
The “gender gap index” describes the degree of difference between sexual inequality to access to political role and education and health resources in 2010. Countries where part of population does not have access to such resources is more sensitive to climate change consequences, because sacrifice part of its potential. The index results from the third cluster of the Principal Component Analysis preformed among 14 potential variables. The analysis identify three dominant variables, namely “literacy gender ratio”, “women political participation” and “life expectancy gender ratio”, assigning a weight of 0.40 to the first one and 0.3 to the others two variables. Before to perform the analysis the variables were score-standardized (converted to distribution with average of 0 and standard deviation of 1; all variables with inverse method) in order to be comparable. The country base data for “literacy gender ratio” (average from 2008 to 2012) and “women political participation” (i.e. proportion of seats held by women in national parliament in the last election) were gathered from World Bank, whereas the “life expectancy gender ratio” (average from 2008 to 2012) data were collected from the medium fertility scenario of UNPD World Population Prospects, the 2012 Revision. Tabular data were linked by country to the national boundaries shapefile (FAO/GAUL) and then converted into raster format (resolution 0.5 arc-minute). Women’s representation in parliaments is one aspect of women’s opportunities in political and public life, and it is therefore linked to women’s empowerment. This indicator gives an idea of the progress of women participation in the highest levels of society, such as the decision making process, and becoming a leader and voice of the community. Gender parity in literacy and thus in education, is an indicator for female participation and can hence be seen as a general measure for gender equality. The equality of educational opportunities is a basic state to increase the status and capabilities of women. This dataset has been produced in the framework of the “Climate change predictions in Sub-Saharan Africa: impacts and adaptations (ClimAfrica)” project, Work Package 4 (WP4). More information on ClimAfrica project is provided in the Supplemental Information section of this metadata.
-

The “natural sensitivity index” relates to the ecological component of sensitivity in 2010 and it is linked to the degree of stress over the ecological systems that sustain the agriculture production. It results from the combination of three underlying indexes: the “natural resources sensitivity index”, the “agriculture resources sensitivity index” and the “water stress index”. These original indexes represent the three principal component identified by Principal Component Analysis among 16 potential variables. The analysis calculated the weights of the three underlying index as 0.45, 0.35 and 0.20 for the “natural resources sensitivity index”, the “agriculture resources sensitivity index” and the “water stress index” respectively. This dataset has been produced in the framework of the “Climate change predictions in Sub-Saharan Africa: impacts and adaptations (ClimAfrica)” project, Work Package 4 (WP4). More information on ClimAfrica project is provided in the Supplemental Information section of this metadata.
-
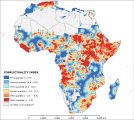
The “conflictuality index” describes the impact that conflicts have in a certain area in 2010. Area subjected to violence and conflict may have problem to receive assistance to develop adaptation measures and may lack the wiliness of the authority to implement such adaptation. The index results from the second cluster of the Principal Component Analysis preformed among 18 potential variables. The analysis identifies two dominant variables, namely “distance from conflict events” and “conflict events density”, assigning equal weights (0.5) to the two variables. Before to perform the analysis the variables were log transformed to shorten the extreme variation and then were score-standardized (converted to distribution with average of 0 and standard deviation of 1; inverse method was applied for “conflicts events density”) in order to be comparable. A shapefile of conflict events was gathered from the Uppsala Conflict Data Programme (UCDP). Considering that the effect of conflict aftermath may during years, we collect all the events position and number of victims from 1989 to 2010. The “distance from conflicts” was obtained via Euclidean distance calculation of the conflict events. The “conflict events density” is the result of a kernel density analysis on number of victims with a search radius of 200 Kilometer. This dataset has been produced in the framework of the “Climate change predictions in Sub-Saharan Africa: impacts and adaptations (ClimAfrica)” project, Work Package 4 (WP4). More information on ClimAfrica project is provided in the Supplemental Information section of this metadata.